Architecture
This page describes the components that make up AgentWatch today, from configuration through to the deployed, observable stack.
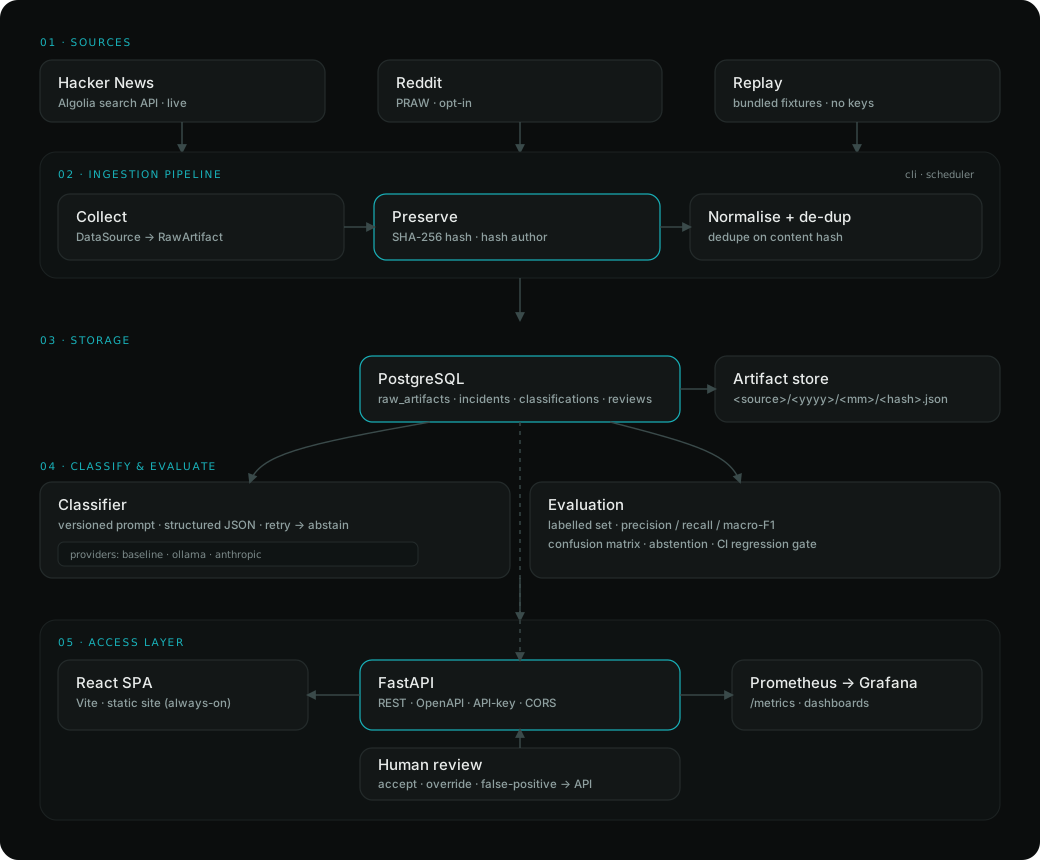
For the why behind each decision — and the tradeoffs — see the System design write-up.
The foundation layer
  environment variables
          │
          ▼
   ┌──────────────┐        ┌──────────────────┐
   │  Settings    │        │  Structured      │
   │  (config.py) │        │  logging         │
   │  validated   │        │  (structlog,     │
   │  at startup  │        │   JSON output)   │
   └──────┬───────┘        └──────────────────┘
          │
          ▼
   ┌──────────────────────────────────────────┐
   │  Database layer (agentwatch/db)            │
   │                                            │
   │  models.py   — 5 SQLAlchemy 2.0 models     │
   │  base.py     — declarative base            │
   │  types.py    — portable JSONB type         │
   │  session.py  — engine + session_scope()    │
   └──────┬─────────────────────────────────────┘
          │
          ▼
   ┌──────────────┐   applied by   ┌──────────────┐
   │  Alembic     │───────────────▶│  PostgreSQL  │  (Docker Compose)
   │  migrations  │                │  or SQLite   │  (tests)
   └──────────────┘                └──────────────┘
Components
Configuration (agentwatch/config.py)
A single Settings object, built on pydantic-settings, reads every setting from
AGENTWATCH_-prefixed environment variables and validates them at startup. A cached
get_settings() accessor gives the rest of the code one consistent source of truth.
There is no configuration scattered through the codebase.
Logging (agentwatch/logging.py)
Logging is configured once, centrally, and emits structured JSON via structlog.
Structured logs are machine-parseable, which matters for a system whose whole purpose
is turning messy input into analysable records. get_logger(name) returns a bound
logger anywhere in the code.
Database layer (agentwatch/db/)
models.pydefines the five tables (see Data model) using SQLAlchemy 2.0's typedMapped[...]style.types.pyprovides a portableJSONBcolumn type: realJSONBon PostgreSQL, and genericJSONon SQLite. This is what lets the identical schema run in production and in fast unit tests.session.pyexposessession_scope(), a context manager that commits on success and rolls back on error, so callers never leak transactions.
Migrations (migrations/)
Schema changes are versioned with Alembic. The initial migration creates all five tables. Because migrations use Alembic's batch mode, they apply cleanly on both PostgreSQL and SQLite.
Containerised database (deploy/docker-compose.yml)
A PostgreSQL 16 service with a health check, mapped to host port 5433 (chosen to
avoid clashing with a Postgres already running locally on 5432). make db-up starts
it; make migrate creates the schema.
The ingestion layer
On top of the foundation sits the pipeline that turns public posts into stored incidents. See Collecting data for the full picture; in short:
  DataSource adapters            (agentwatch/collectors)
   replay | hackernews | reddit
          │  fetch(since) -> RawArtifact[]
          ▼
  ingest: hash, de-duplicate,    (agentwatch/pipeline/ingest.py)
          store evidence, write
          raw_artifacts + incidents
          ▼
  orchestration: one CollectionRun  (agentwatch/pipeline/collect.py)
          per source, failures isolated
          ▲
  CLI  (agentwatch/cli.py)   and   scheduler  (agentwatch/scheduler.py)
Each source implements one small interface (name + fetch), so adding a source is a
single new file. Evidence is written to disk before anything else, keyed by SHA-256,
and the database write is de-duplicated on the same hash.
The classification layer
Stored incidents are classified by a pluggable provider and scored by an evaluation harness. See Classification & evaluation; in short:
  incident  →  build versioned prompt  →  LLMProvider.generate()
                                              baseline | ollama | anthropic
                                                    │  JSON
                                                    ▼
                                    validate → retry once → abstain on failure
                                                    │
                                                    ▼
                                    Classification row (model_name, prompt_version…)

  evaluation:  labelled dataset  →  classifier  →  metrics (macro-F1, confusion, …)
               guarded by a regression test with a committed macro-F1 floor
The provider interface is uniform, so the deterministic baseline (default, hermetic), a local Ollama model, and the optional Anthropic backend are interchangeable — and the same evaluation runs against any of them.
The web layer
Stored, classified incidents are exposed through a FastAPI service, and a React (Vite + TypeScript + Tailwind) dashboard consumes that API. See API & dashboard.
  PostgreSQL / SQLite
        ▲
        │ queries (agentwatch/api/queries.py)
        │
  FastAPI app (agentwatch/api/app.py)
   GET /incidents · GET /incidents/{id} · POST /incidents/{id}/review
   GET /stats · GET /exports/incidents.csv · GET /health
   (writes/export gated by X-API-Key when AGENTWATCH_API_KEY is set)
        ▲
        │ HTTP (AgentWatchClient)
        │
  React single-page app (frontend/, Vite + TypeScript + Tailwind)
   Overview · Incident Explorer · Review Queue
The dashboard never touches the database directly — it uses the same API that any external consumer would, so the API is the single access layer.
Observability & deployment
The API exposes DB-derived Prometheus metrics at /metrics; Prometheus scrapes them
and Grafana (provisioned as code) visualises them. The whole system is one
docker compose stack behind a Caddy reverse proxy. See
Deployment & observability.
  agentwatch CLI ─┐
                  ├─▶ PostgreSQL ◀─ FastAPI (/metrics) ◀─ Prometheus ─▶ Grafana
  scheduler ──────┘                      ▲
                                         │  (all services on one compose network)
                          Caddy ─▶ dashboard / api / grafana   (auto-HTTPS in prod)
Metrics are derived from the database, so they stay correct even though the collector CLI and the API server are separate processes.
Portability: PostgreSQL and SQLite
A deliberate design goal is that the same schema and code run on two databases:
- PostgreSQL in real use, for concurrency and native JSONB.
- SQLite in the test suite, so tests need no external services and run in under a second.
The portable JSONB type and Alembic batch migrations are what make this work.